ESPA analysis center screen
This topic describes the purpose of the ESPA analysis center screen, including how to access it and all the settings and buttons on it.
This feature requires your account to be configured with the ESPA analysis center screen.
The ESPA analysis center screen allows you to view and investigate case data with interactive drill down features on a map. For example, it allows you to visually investigate the target locations you entered alongside the CDR information that you uploaded. This allows you to correlate the proximity of a phone call to a location at a specific time. Once you have visually investigated the information displayed, this screen allows you to prepare analysis evidence. To prepare analysis evidence for a case you configure the analysis you want to run, run the analysis and then view the results. The results can be viewed on this screen in addition to you being able to download them and view them in Google Earth and Microsoft MapPoint.
The ESPA analysis center screen also provides:
- many other investigatory features, for further information refer to Investigating case data visually on the ESPA analysis center.
- the ability to generate advanced analysis reports which can be output to Microsoft Word and Microsoft PowerPoint, for further information refer to Using advanced analysis reports.
- narratives which allow you to replay key events, for further information refer to Using narratives.
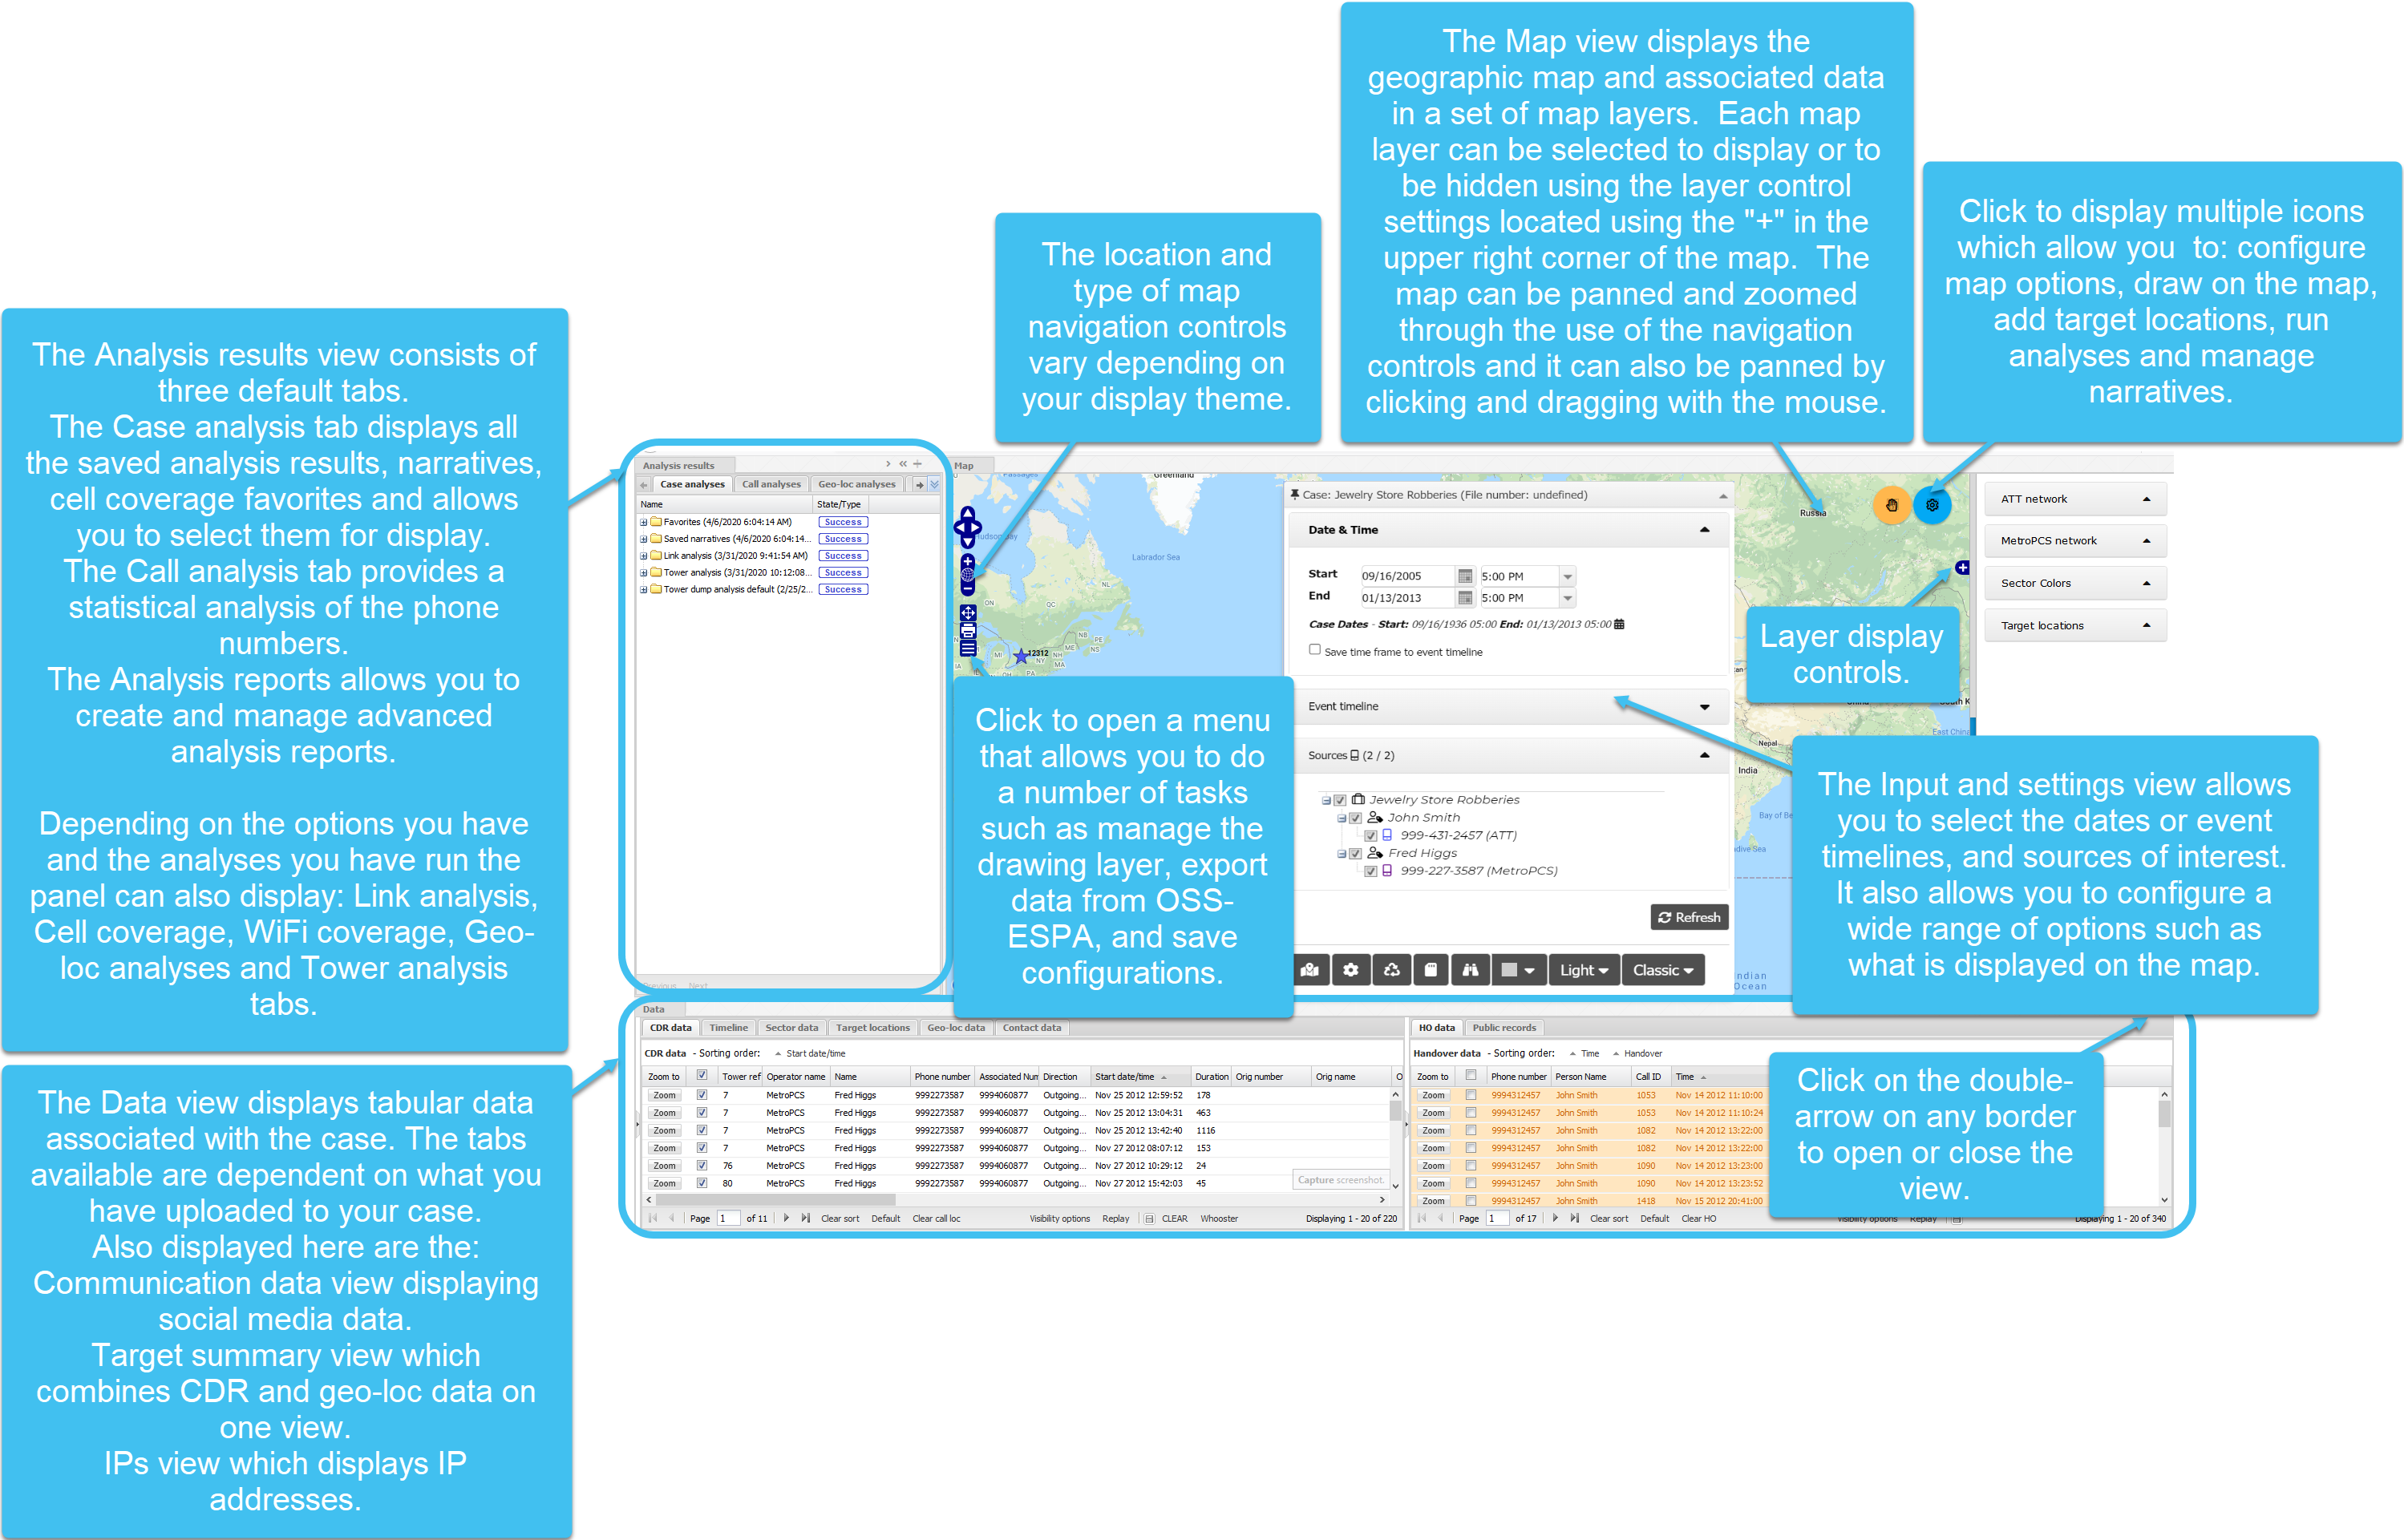
The screen contains five different views; the Input and settings, Map, Legend/Filter, Data and Case management views. The following diagram describes the purpose of the different views.
With the ESPA analysis center, simply because a view is attached to a particular area of the screen by default, does not mean it has to stay there. You can float a view by clicking the view and dragging it down until it floats. Once a view is floating you can attach it to a particular part of the screen, this is known as docking. To float, move and dock a view, click in the view title and float it, then drag it to the region where you want to dock it, and drop it in the region. If your workspace is large, for example if you are using multiple monitors, this analysis center also provides the flexibility to open the different views in separate browser windows.
The appearance of the ESPA analysis center screen can be changed by selecting other themes. The screen captures in this Help all use Gladiator Forensics Light theme. For further information on using themes refer to Setting the ESPA analysis center screen's appearance.
NOTE: Once you have opened the screen it is recommended that you adjust your views before refreshing your case data.
Click here for a short video of an overview of the ESPA analysis center.
For more details on each of the views, refer to the individual topics.
When you have a case selected click  which is at the top-right of every screen to open the ESPA analysis center.